


Defenses Can't Find Holes in Clippers' Screens
It’s no secret that the Clippers love to run the pick-and-roll. And why shouldn’t they? They boast two starting big men, Blake Griffin and DeAndre Jordan, who are both quick to the basket and explosive finishers at the rim. Just as important, if not more, seven-time All-Star point guard Chris Paul is a precision passer, with possibly the best court vision in the league. In addition, Griffin’s enhanced midrange game this season gives the Clippers many more opportunities to pick and pop, effectively diversifying their screen offense and making the Clippers’ offense less predictable than it has been in years past.
The Clippers actually set fewer screens than the league average at 0.98 Set Screens per Chance, but when they do, the screens tend to be highly effective. Los Angeles is leading the league in both Set Screen Points per Chance with 0.20 (league average = 0.14), as well as Set Screen Outcome Efficiency at a rate of 17.77 (league average = 13.35). Set Screen Outcome Efficiency is a Vantage Stat that measures the percentage of set screens that result in a teammate score, a missed open shot, a shooting foul, or an Assist+. It should also be noted that the Clippers boast the league’s fourth-highest Solid Screen% at 76.01.
The Clippers’ best screen setters are easily DeAndre Jordan, Blake Griffin, and Glen “Big Baby” Davis. In fact, these three guys are among the best in the NBA at setting picks. Griffin is tied for 4th of 63 power forwards and tied for 19th of 301 qualified players with .098 Set Screen Points per Chance. DeAndre Jordan is even better, tied for 7th in the entire league with .11 Set Screen Points per Chance. Davis clocks in with an impressive .12 Set Screen Points per Chance average, but he fails to qualify on the individual leaderboard given too low of a set-screen sample. Davis does qualify, however, in Set Screen Efficiency, a category in which he leads all NBA players with a 23.27 mark. Griffin places an impressive 4th in the NBA and Jordan ranks 10th with Set Screen Efficiency marks of 20.85 and 19.35, respectively. In other words, the Clippers have three players in the league’s top 10 in Set Screen Efficiency.
How often do those three set screens? Seemingly not nearly enough. Griffin and Jordan each set .46 Screens per Chance, which ranks tied for 67th in the league. Davis sets .52 Screens per Chance, which would tie for 42nd if he had set enough to qualify (he plays only 10.7 minutes per game). Jordan and Davis both possess Solid Screen%’s well above league average at 78.84 and 77.71, respectively. Griffin’s Solid Screen% is a tick below the league average, but his quickness more than makes up for that. Here are some examples of why even when Griffin doesn’t make contact with the nearby defender, his quickness can make that defender pay for even the slighest hesitation.
Chris Paul, easily the league leader in Assist+ per 100 Chances (a Vantage Stat that includes assists, passes to missed open shots, passes to shooting fouls, and crucial passes leading to assists) boasts a high 46.58 Assist+ Screen%. That means that 46.58 percent of his Assist+ come from screens received. Tony Parker holds a league-leading 58.80 Assist+ Screen%, but Paul is accumulating many more Assist+ per 100 Chances, and his team scores more efficiently when he receives screens. Paul leads 301 eligible players with 0.12 Screens Received Points per Chance (Parker is not too far behind at 0.10 Screens Received Points per Chance). As a team, 33.05 percent of the Clippers’ Assist+ have come from received screens, which gives Los Angeles the fourth-best rate in the league (NBA average = 27.30).
Chris Paul has amassed 180 assists on plays in which he’s received an on-ball screen. On plays in which Paul has received an on-ball screen, there were 28 additional instances where the open shot was missed (counts as a Vantage Assist+ but not a traditional assist), 29 times that Paul passed to a player who was fouled in the act of shooting (also an Assist+), and 32 times that a turnover was committed.
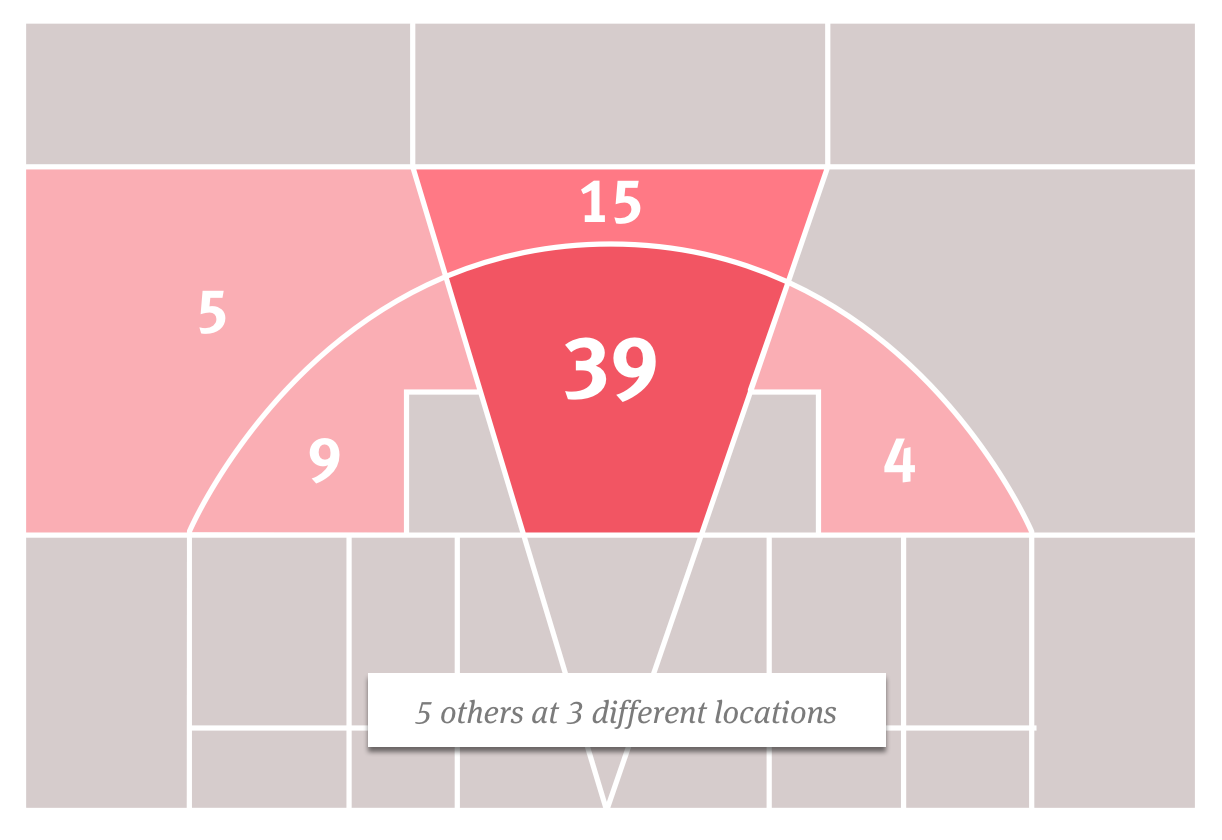
Here are Chris Paul’s 180 post-screen (received, on-ball screens) assists broken down by location. The locations below represent where the screens were set and not necessarily where the pass was made (note how symmetrical, particularly with regard to the frequency of screens on the left and right sides of the court).
LOCATIONS OF CHRIS PAUL’S RECEIVED, ON-BALL SCREENS LEADING TO ASSISTS:
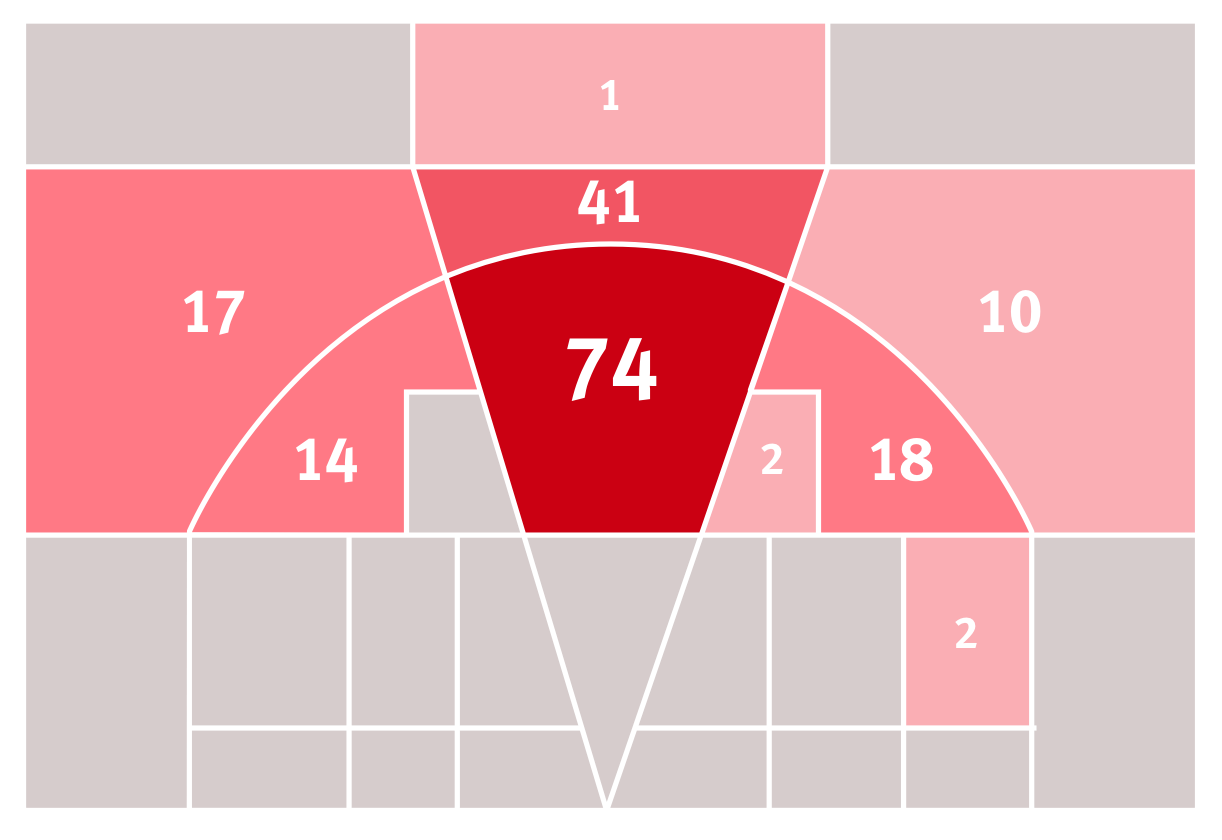
Paul really likes to get into the teeth of the defense before receiving an on-ball screen, which is why he flourishes with picks set for him at the high post. After the high post, he gets the second-highest number of post-screen assists from beyond the arc, right at the top of the key.
Out of Chris Paul’s 74 high-post, received, on-ball screens that have resulted in a Clippers assist, Paul used 89.2 percent (66 of 74) of those screens. He refused the screen 4 times and refused with a right-to-left crossover or a left-to-right crossover 2 times apiece. Of the other 106 screens received by Paul that ended in an assist, Paul used a considerably lower 81.1 percent (86 of 106) of those.
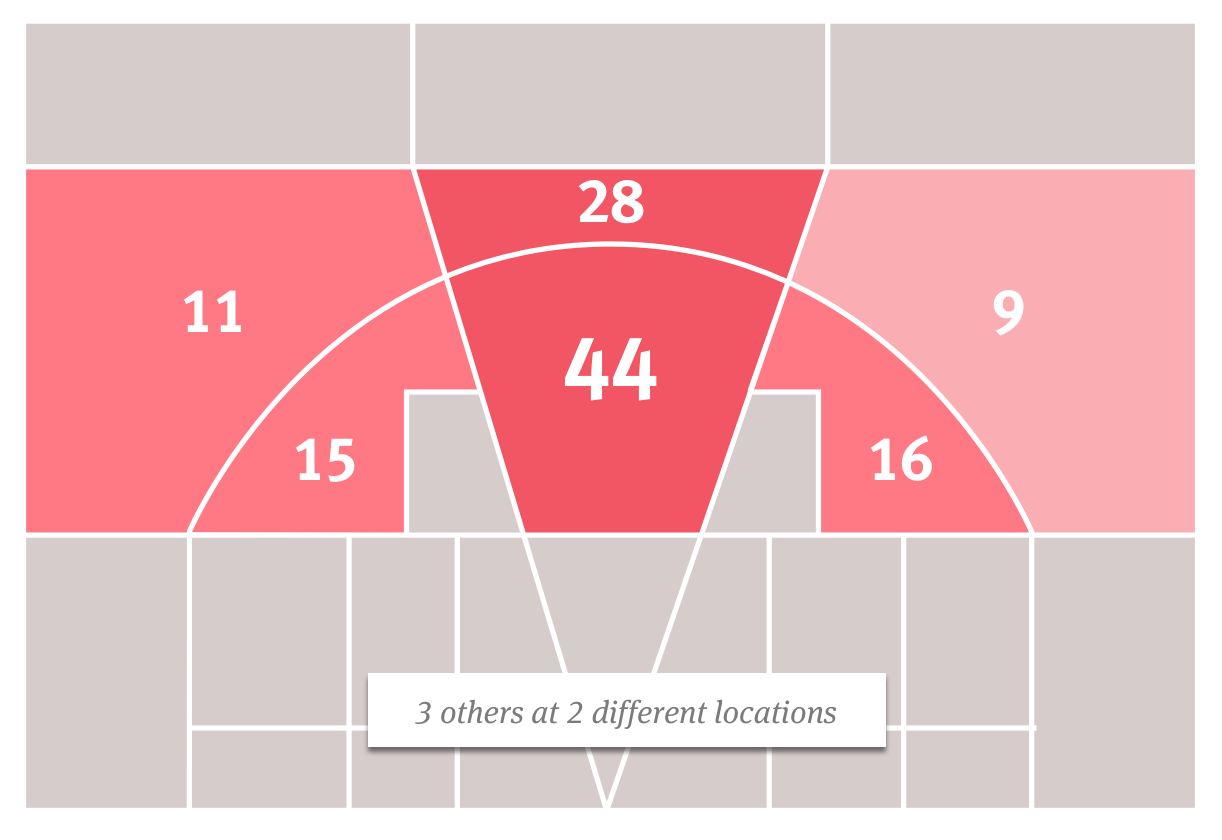
Here are the Clippers’ remaining 126 (306 minus Paul’s 180) post-screen (received, on-ball) assists broken down by location.
LOCATIONS OF CLIPPERS’ RECEIVED, ON-BALL SCREENS LEADING TO ASSISTS (EXCLUDING PAUL’S):
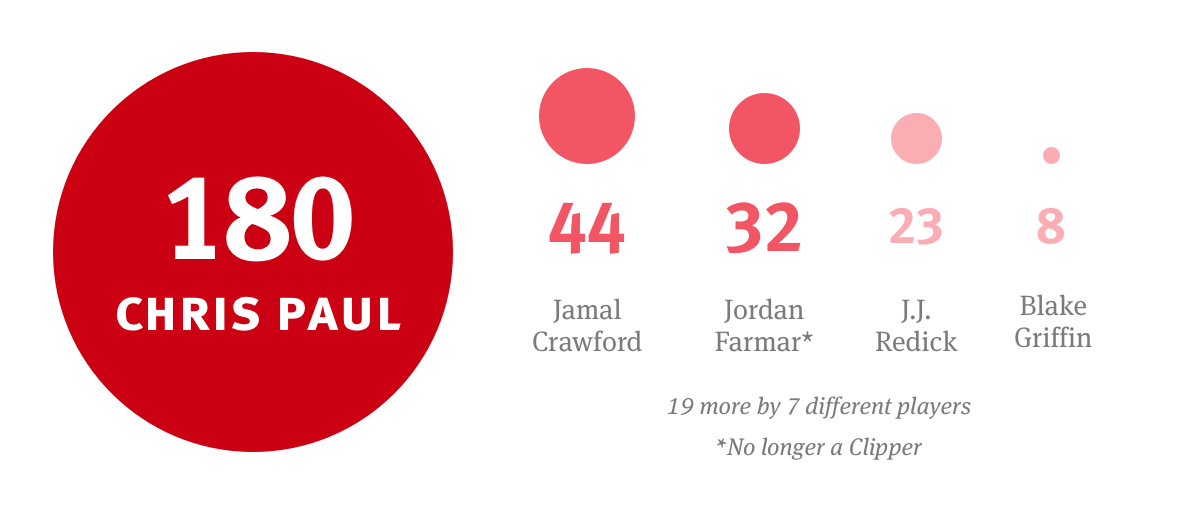
Broken down by player, unsurprisingly, Paul leads the Clippers in these post-screen assists. The disparity between his output and the second-best Clipper is significant, a result of Paul’s excellence coming off screens and spectacular court vision combined with his teammates’ mediocrity in those departments. The Clippers’ third-best player according to this metric was waived by the team on January 16. Below are breakdowns for each Clipper of total post-screen assists and total on-ball screens set resulting in an assist this season.
TOTAL POST-SCREEN ASSISTS:
TOTAL ON-BALL SCREENS SET RESULTING IN AN ASSIST:
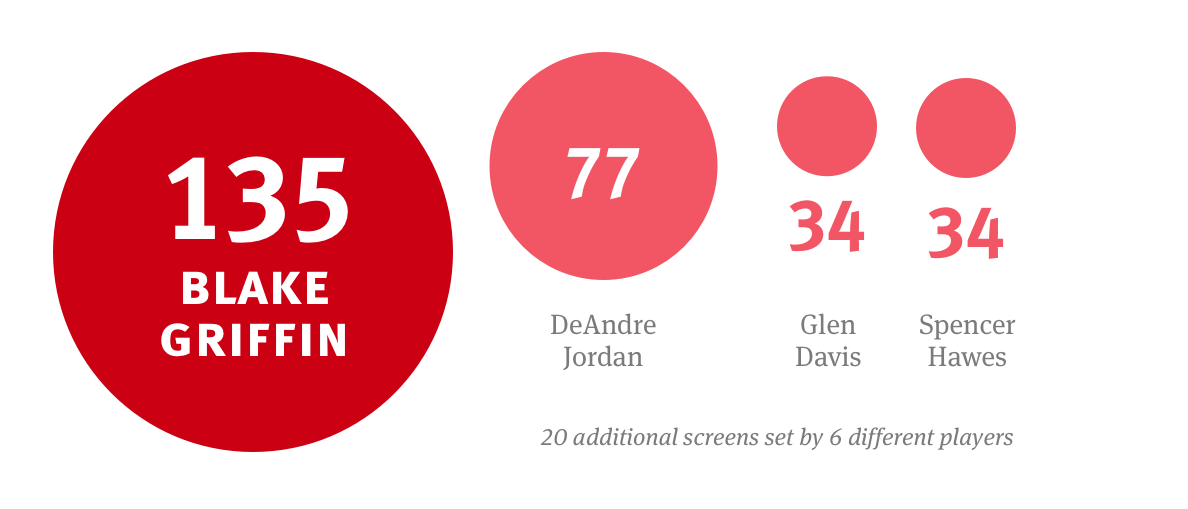
Griffin’s success here can be further broken down by Vantage data. Of these 135 assist-resulting on-ball screens, Griffin rolled on 50 of them, popped on 35, and had no roll or pop on 50. He received the ball 80 times following these screens. His 63.70 Solid Screen% on these screens is a result of making contact with or rerouting the defender 85 times, making no contact or reroute 24 times, 23 slip screens, 2 screens involving no effort, and 1 screen where contact was made but the defender was not rerouted.
LOCATION OF GRIFFIN’S ON-BALL SCREENS SET RESULTING IN ASSISTS:

Of the 24 assist-resulting, on-ball screens set by Blake Griffin on the two-point left wing, he rolled 11 times (45.8 percent), popped 5 times, and didn’t roll or pop 8 times. Of the remaining 111 of such screens, he rolled only 35.1 percent of the time.
DeAndre Jordan has the Clippers’ second-most success in setting on-ball screens resulting in an assist with a total of 77. He rolled on 54 of these screens, popped on 3, and neither rolled nor popped on 20. He received the ball 25 times. His 74.03 Solid Screen% on these screens is the result of making contact with or rerouting the defender 53 times, making no contact or reroute 11 times, 9 slip screens, and 4 screens where contact was made but the defender was not rerouted.
LOCATION OF JORDAN’S ON-BALL SCREENS SET RESULTING IN ASSISTS:
On Jordan’s 39 high-post, on-ball screens resulting in a Clippers assist, he received the ball 18 times (46.2 percent). Of the 38 on-ball screens resulting in a Clippers assist that were set elsewhere, Jordan rarely received the ball (18.4 percent).
The Clippers’ efficiency in the screen-setting game is dominating other teams this season. Their Set Screen Outcome Efficiency is more than 1 percentage point higher than the Mavs, who are the next best team. But the Mavs’ Set Screens per Chance is also top 10 in the league, whereas the Clippers rank 18th. Moreover, the Clippers seem to be setting even fewer screens as the season goes on, as they rank 24th in Set Screens per Chance over the last month. How the Clippers leverage their screen-setting efficiency in the second half of the season (and into the playoffs if they make it) will be something to keep an eye on.
Originally published by Vantage Sports